
Activity & Analytics
Analytics Dashboard
Focus time stats, charts, top apps, context switching, and insights.
The Activity section (⌘3) is FocusMo's analytics dashboard. Pick a time range — Day / Week / Month / Year — and explore.
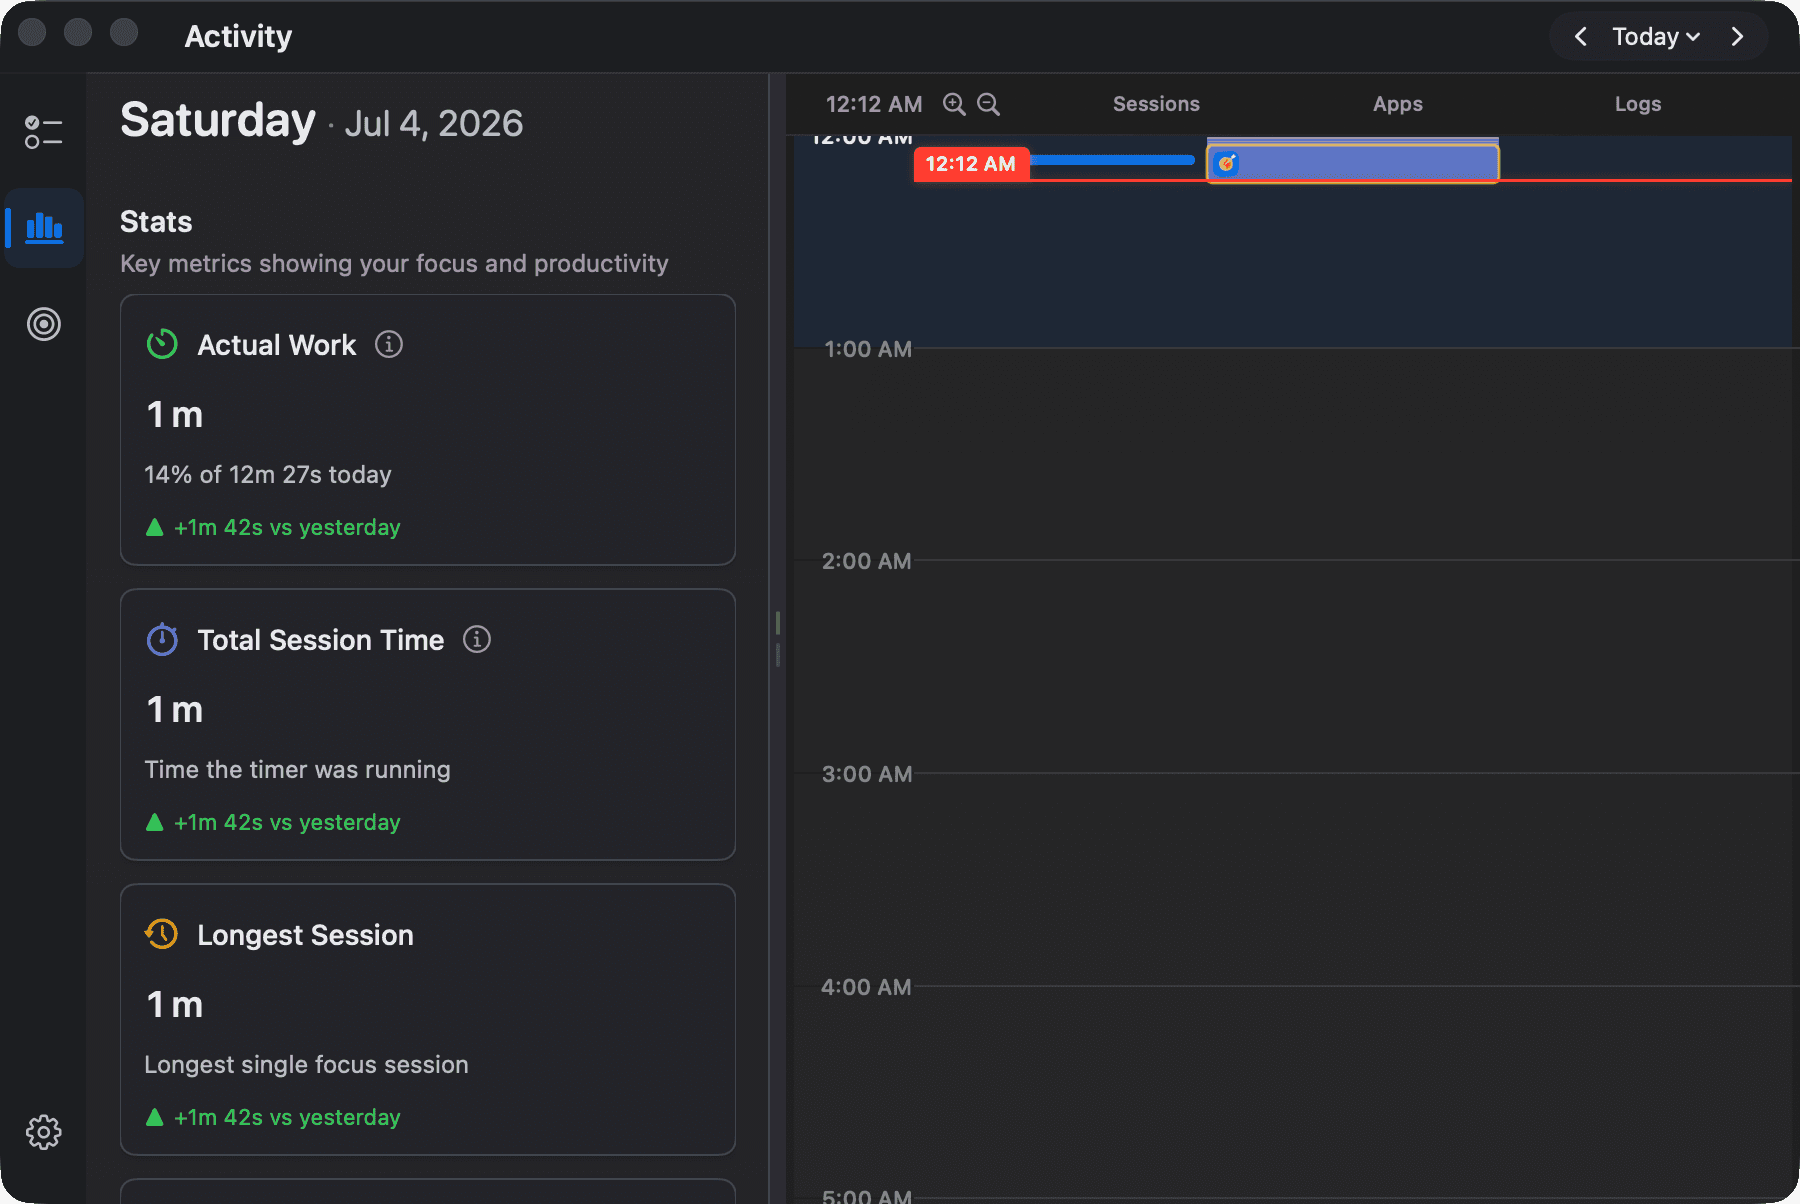
Stat cards
At the top: Focus Time, Tasks Completed, Average Session, and Longest Session for the selected range.
Charts and sections
- Focus Time & Tasks chart — your focus volume over time.
- Streak card & badge grid — tap through to the Daily Goal hub.
- Top Used Apps — a ranked list of your most-used apps with session counts.
- Context Switching (Beta) — total app switches, switches per hour, and average time between switches. High numbers here are usually where focus leaks.
Insights panel
Computed automatically from your data:
- Peak Productivity Hour — the hour of day when you focus most.
- Consistency Score — how regular your focus habit is, as a percentage.
- Hourly Performance heatmap — which hours of the day you actually work.
- Totals: focus time, sessions, average session, breaks taken, Pomodoros completed, current and longest streak, daily average.
Interaction tips
- Sections are collapsible — hide what you don't use.
- Navigate metric cards with the arrow keys and press Enter to drill in.
- When viewing today, data refreshes live every few seconds.
Free vs Pro
All ranges are visible for everyone, but free accounts see the last 3 days of data. Week, Month, and Year views show an upgrade banner; full history, trends, and long-term insights require Pro.